
Sales funnel reports are essential tools for visualizing and optimizing how prospects move through your sales process. These reports track the customer journey from initial awareness to final purchase, revealing exactly where deals are won or lost.
For sales and marketing professionals, business owners, and revenue leaders, understanding sales funnel reports is crucial for making data-driven decisions that directly impact revenue growth.
What you’ll learn in this guide:
- 7 real-world sales funnel report examples with specific use cases
- Key metrics to track at each funnel stage (conversion rates, revenue, velocity)
- How to identify and fix funnel bottlenecks that leak revenue
- Best tools and software for creating actionable sales dashboards
- Best practices for measuring and improving funnel performance
Why sales funnel reports matter: Companies that actively monitor funnel metrics see 28% higher revenue growth than those that don’t. These reports allow you to visualize the customer journey, identify drop-off points, make data-driven decisions to improve conversion rates, and align sales and marketing efforts for maximum impact.
Definition and Benefits of a Sales Funnel Report
What is a Sales Funnel Report?
A sales funnel report is a powerful tool that provides valuable insights into your sales process, helping you analyze and optimize each stage. It serves as a comprehensive analysis tool that visualizes and tracks customer progression through marketing and sales activities, from initial contact to conversion and beyond.
Key Benefits
- Improved Sales Performance: Pinpoint bottlenecks and inefficiencies to streamline your sales process and boost productivity.
- Increased Revenue: Optimize your sales funnel to achieve higher conversion rates and more revenue.
- Enhanced Customer Engagement: Understand the customer journey to tailor your approach and improve satisfaction.
- Better Decision-Making: Use clear data and insights to make informed decisions that tie marketing efforts directly to revenue and pipeline value.
- Identification of Bottlenecks and Areas for Improvement: Highlight where prospects drop off, enabling you to address issues and improve your funnel’s effectiveness.
Collecting Input Data
Collecting input data from various sources, such as sales metrics and website traffic, is essential for building accurate funnel reports and making informed decisions.
Summary Table: Key Metrics and Insights in a Sales Funnel Report
A sales funnel report is a visual representation that tracks how prospects move through the stages of the buying journey. Below is a summary of the key metrics and insights every sales funnel report should provide:
Metric/Insight | Description |
|---|---|
Funnel Stages | Tracks each stage from Awareness to Action (and Retention, if applicable) |
Opportunity Count | Number of prospects or deals at each stage |
Conversion Rates | Percentage of prospects moving from one stage to the next |
Drop-off Points | Identifies where prospects exit the funnel |
Revenue by Stage | Amount of revenue associated with each stage |
Stage Duration | Average time prospects spend in each stage |
Performance Breakdowns | Highlights where funnel performance breaks down |
Data-Driven Insights | Provides actionable insights into the effectiveness of sales strategies and marketing efforts |
Diagnosis of Success/Failure | Helps diagnose what’s working and where growth is being lost |
Now that we’ve covered what a sales funnel report is and why it’s important, let’s explore the stages of the sales process in more detail.
Essential Metrics Every Sales Funnel Report Must Track
Effective sales funnel reports go beyond simple opportunity counts. Here are the critical metrics that separate basic reports from actionable insights:
1. Conversion Rate by Stage
What it measures: Percentage of prospects moving from one stage to the next.
Why it matters: Identifies which stages perform well and which need improvement.
Benchmark: Healthy B2B funnels typically see:
- Lead to Qualified Lead: 13-20%
- Qualified Lead to Opportunity: 20-30%
- Opportunity to Closed-Won: 20-30%
2. Stage Duration (Sales Velocity)
What it measures: Average time prospects spend in each stage.
Why it matters: Long durations signal bottlenecks; tracking velocity helps forecast revenue more accurately.
How to calculate: (Number of opportunities × Average deal value × Win rate) / Sales cycle length in days
3. Win/Loss Rate
What it measures: Percentage of opportunities that close successfully vs. those lost.
Why it matters: Reveals overall funnel health and competitive positioning.
Actionable insight: Win rates below 20% suggest poor lead qualification or product-market fit issues.
4. Average Deal Size by Stage
What it measures: Expected revenue value at each funnel stage.
Why it matters: Helps prioritize high-value opportunities and forecast revenue accurately.
Best practice: Track how deal size changes as opportunities progress—deals that shrink often indicate pricing objections.
5. Lead Source Performance
What it measures: Conversion rates and revenue by original lead source (organic, paid ads, referrals, events).
Why it matters: Shows which marketing channels drive highest-quality leads.
Optimization tip: Allocate more budget to channels with highest conversion rates, not just highest lead volume.
6. Funnel Drop-off Rate
What it measures: Percentage of prospects lost at each stage.
Why it matters: Quantifies exactly where revenue is leaking.
Critical threshold: If any single stage has >50% drop-off, it requires immediate attention.
Pro Tip: Don’t track metrics in isolation. The most powerful insights come from comparing metrics across stages. For example, a 40% conversion rate from Lead to Opportunity means nothing if those opportunities only close at 5%—you’re qualifying the wrong leads. Use real-time dashboards to monitor these relationships continuously.
Understanding the Sales Process
A sales funnel report is a visual representation that tracks how prospects move through the stages of the buying journey. Sales funnel reports allow sales teams to track every stage of the funnel, from awareness to action, and sometimes retention. Understanding these stages is crucial for creating effective sales funnel reports.
Standard Sales Funnel Stages
Before diving into the specifics, here’s a brief overview of the standard sales funnel stages:
- Awareness: The stage where potential customers first discover a brand through platforms like social media, ads, or SEO.
- Interest: Prospects actively seek more information about a product by engaging with educational content.
- Decision: High-intent leads evaluate a solution against competitors, which may include requesting demos or comparing pricing.
- Action: The stage where a lead becomes a paying customer.
- Retention/Loyalty: Tracks post-purchase behavior, such as repeat purchases or renewals, in some sales funnel reports.
Prospecting
Prospecting is the initial stage where you identify potential customers who might be interested in your product or service. This aligns with the Awareness stage, where prospects first encounter your brand.
Lead Qualification
Lead Qualification involves determining whether these prospects have the need, budget, and authority to make a purchase. This typically falls under the Interest stage, as prospects engage with your content and show intent.
Sales Call or Meeting
Sales Call or Meeting is where you engage with qualified leads to understand their needs and present your solution. This is part of the Decision stage, where leads are evaluating your offering.
Proposal
Proposal involves crafting a tailored proposal that addresses the prospect’s needs and outlines the benefits of your offering. This continues the Decision stage, as prospects compare your solution to others.
Negotiation and Commitment
Negotiation and Commitment is the stage where you discuss terms and address any objections to reach a mutual agreement. This is the final part of the Decision stage.
Contract Signing
Contract Signing is where the deal is finalized and paperwork is signed. This marks the transition from Decision to Action, as the lead becomes a customer.
Post-Purchase (Retention/Loyalty)
Post-Purchase ensures customer satisfaction and fosters long-term relationships. This is the Retention/Loyalty stage, tracking repeat purchases or renewals.
With a clear understanding of each stage, we can now look at how these stages are visually represented in sales funnel reports.
Visually Depicted Sales Funnel Stages and Opportunities
We’re starting off simple with an example from Insight Squared.
Their report example works great if you want to improve your understanding of your funnel, and if you haven’t been tracking a lot so far.
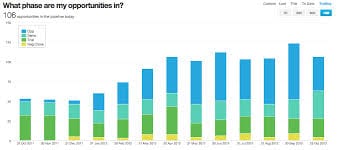
The very least your sales funnel report should contain is:
- Opportunity count
- Sales funnel stages
The benefits of a sales funnel report are numerous: monitoring sales funnel performance is crucial to optimize sales and marketing strategies. Utilizing data analysis and real-time reporting can significantly enhance this performance.
In order to be able to review the information at a glance, you can even put it in a neat visual representation, such as a chart or diagram, which makes complex sales funnel data easier to interpret and analyze.
By the time you’ve reviewed it, you’ll know exactly which stage holds the most opportunities. It’s easy to optimize accordingly after that.
Now that you’ve seen how sales funnel stages and opportunities can be visualized, let’s explore how marketing automation can further enhance your sales funnel.
Marketing Automation and Sales Funnels
Benefits of Marketing Automation
Marketing automation has become an essential part of building an effective sales funnel, allowing businesses to streamline their marketing and sales efforts for maximum impact. By automating repetitive tasks—such as sending follow-up emails, nurturing leads, and segmenting audiences—companies can focus their sales efforts on converting the most promising leads into paying customers.
Examples of Automation in Sales Funnels
A well-integrated sales funnel powered by marketing automation can significantly boost conversion rates and reduce customer acquisition cost. For example, a company might use marketing automation to send personalized emails to potential customers who have abandoned their shopping cart, encouraging them to complete their purchase. By tracking the performance of these automated campaigns, businesses can refine their marketing strategies and improve sales velocity.
Collaboration Between Teams
Marketing automation also enables seamless collaboration between marketing and sales teams, ensuring that leads are nurtured efficiently through every stage of the funnel. This not only increases the likelihood of turning leads into customers but also provides valuable data for ongoing optimization. Ultimately, combining marketing automation with a robust sales funnel that clearly defines each stage of the customer journey empowers companies to generate more leads, close deals faster, and drive sustainable growth.
With marketing automation in place, let’s shift our focus to how revenue can be highlighted and tracked within your sales funnel report.
Revenue Matters: Highlight It with Your Sales Funnel Report
While opportunity counts broken down by stages matter, what matters most is the end goal: your revenue, and how you earn it.
Understanding each stage of the sales process is crucial for creating an effective sales funnel report. A company funnel can help monitor the progression of contacts and deals through these stages, identifying drop-off points and evaluating the effectiveness of each stage.
Our next example from Gary Smith depicts a sales funnel report that incorporates:
- Sum of amount
- Stages
- Close dates
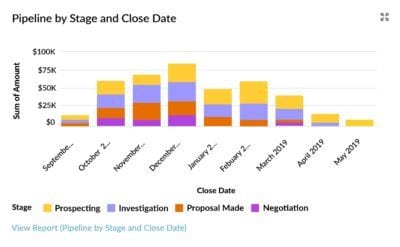
When you create such a report, you can easily see the revenue you are bringing in (or failing to bring in) at each stage.
Additionally, you’ll be able to make more accurate financial projections when you know how much money you’ll likely earn in a given time. Selecting an appropriate date range for your analysis is crucial for generating accurate insights and forecasts. Sales forecasting, enabled by these reports, helps predict future revenue and improve sales strategies.
Creating such a report won’t take up too much of your time. However, once you’re done, you’ll know exactly what to do next.
Now that you understand how to track revenue, let’s examine how to identify and address funnel leakage.
Funnel Leakage
When you’re struggling with funnel leakage, the most important thing is defining where the leakage occurs.
However, the main prerequisite for this is tracking your sales funnel stages and revenue generated through each.
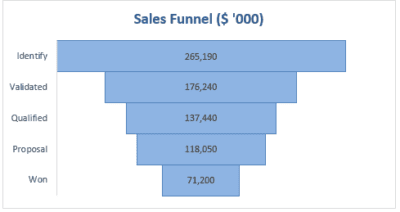
This Trump Excel sales funnel report example sums up everything you need to know about your leakage.
It shows you exactly how much money leaks through your funnel – stage by stage. In this particular example, we can see that the most notable decrease is between the identification and qualification stages.
They may be different for your sales team. However, you need to see the hole to plug the leak.
With leakage identified, let’s move on to understanding the fluidity of your sales funnel and how conversion rates can be tracked at each phase.
The Fluidity of Your Sales Funnel
In many ways, a sales funnel is like a clock; all the mechanisms have to work seamlessly in order to tell you the time.
If your customers feel like they are naturally progressing through each stage (and if your chosen methods are efficient), you will be able to gauge it from a phase-by-phase funnel conversion report.
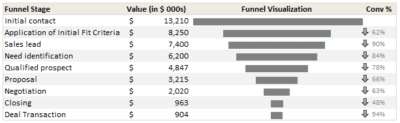
The folks at Chandoo are using the two major elements to every sales funnel report (the value of opportunities/opportunities count, and the phases). However, they are visualizing the phases, as well as adding a phase-by-phase conversion rate.
This way, they can see that the worst performer is the closing stage; from which only 48% of prospects successfully convert to customers.
With conversion rates in mind, let’s discuss how landing page optimization can further improve your funnel’s effectiveness.
Landing Page Optimization
Landing page optimization is a critical factor in the success of any sales funnel. A well-crafted landing page serves as the gateway for potential customers, guiding them toward becoming qualified leads and, ultimately, paying customers. To maximize the effectiveness of your sales funnel, it’s essential to focus on key metrics such as conversion rates, click-through rates, and customer engagement.
Using tools like Google Analytics, businesses can track how visitors interact with their landing pages, identifying which elements drive the most conversions. For instance, a company might conduct A/B testing to compare different landing page designs, headlines, or calls-to-action, determining which version delivers the highest conversion rates. By continuously optimizing landing pages based on data, companies can ensure that their sales funnel remains efficient and effective.
Optimized landing pages not only improve the chances of capturing new leads but also enhance the overall customer experience. This leads to higher engagement, more qualified leads entering the funnel, and a greater number of paying customers at the end of the sales process.
After optimizing your landing pages, it’s important to monitor the performance of your sales team to ensure continued success.
Sales Team (Member) Performance
In addition to monitoring your overall results, you can also use a sales funnel report to monitor the performance of your sales teams with dedicated sales leaderboard and tracking software.
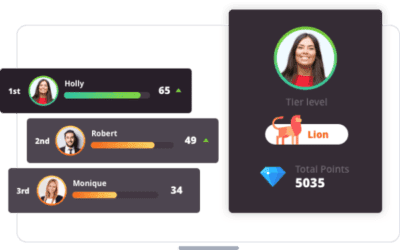
Spinify dashboards not only motivate employees; they track their performance and progress with highly customizable leaderboards that shape sales success.
Reporting tools built into CRM platforms, such as Salesforce and Close, help track sales metrics, generate funnel reports, and improve overall sales performance for small businesses and startups, especially when you know how to create a sales dashboard in Excel and integrated tools.
After setting the KPIs that matter most to your company and your team, you and individual team members will get automatic achievement notifications whenever they perform actions which bring you closer to your target.
This way, you aren’t just getting a sales funnel report. You’re actively improving the figures you’ll see on it by applying creative ways to maximize a gamified sales dashboard.
With team performance tracked, let’s see how content marketing can further support your sales funnel.
Content Marketing and Sales Funnels
Content marketing is a powerful driver of success within the sales funnel, helping businesses attract, educate, and nurture potential customers throughout their buying journey. By creating and sharing valuable insights through blog posts, social media posts, and email newsletters, companies can engage their target audience at every stage of the funnel.
A strategic content marketing approach aligns with the sales funnel by delivering the right information at the right time. For example, educational blog posts can raise awareness among potential customers, while in-depth guides and case studies can help move qualified leads closer to making a purchase. Social media posts and email campaigns keep your brand top-of-mind, fostering trust and encouraging customer engagement.
By consistently providing relevant and helpful content, businesses position themselves as industry leaders and build strong relationships with their audience. This not only increases the likelihood of converting leads into paying customers but also supports long-term customer loyalty and advocacy.
With content marketing in place, let’s move on to how you can gain a holistic view of your sales performance with executive dashboards.
Holistic View of Your Sales Performance
If you are ready to take your sales funnel report game to the next level, you’ll need an executive sales funnel dashboard that makes it easy to track sales KPIs with real-time leaderboards.
Not only will it include opportunities and stages; it should also include team performance, closed deals, and so much more.
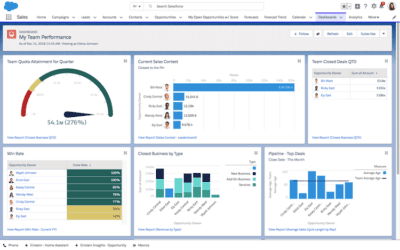
This Salesforce report example may seem complicated, but it is actually allowing you to understand how leaderboard software for sales teams can surface the most important performance insights:
- The types of deals you’re closing at certain stages
- The performance of your sales reps
- Key clients you should focus on
An executive dashboard should also track the effectiveness of different marketing channels and marketing efforts to guide potential customers through the funnel.
With a holistic view in place, let’s see how Google Analytics can be used for deeper sales funnel analysis.
Using Google Analytics for Sales Funnel Analysis
Google Analytics is an indispensable tool for analyzing and optimizing your sales funnel. By tracking key metrics such as conversion rates, sales velocity, and customer acquisition cost, businesses can gain valuable insights into how their sales funnel is performing and where improvements can be made.
With Google Analytics, companies can monitor the effectiveness of specific marketing campaigns and channels, allowing for data-backed decisions that refine marketing strategies. For example, tracking the performance of social media campaigns can reveal which platforms are generating the most conversions, enabling businesses to allocate resources more effectively.
Additionally, Google Analytics provides detailed reports on user behavior, helping companies understand how potential customers move through the funnel and where drop-offs occur. By leveraging these insights, businesses can optimize each stage of the sales funnel, improve marketing ROI, and drive more paying customers through to the final step of the sales process.
With analytics in hand, let’s discuss how to manage your sales pipeline for ongoing success.
Sales Pipeline Management
Sales pipeline management is the backbone of a successful sales strategy. It involves organizing and managing customer data, tracking interactions, and monitoring the progress of deals through each stage of the sales process. Effective sales pipeline management ensures that your sales pipeline remains healthy and that your sales goals are met.
Using tools and software to manage your sales pipeline allows you to:
- Track Deals: Keep an eye on where each deal stands in the sales process.
- Monitor Interactions: CRM systems can enhance customer interactions by leveraging features like triggers, workflows, and detailed interaction histories, allowing you to record and analyze every interaction with prospects to understand their needs and preferences.
- Propel Deals Forward: Identify and address any obstacles that might be slowing down the progress of deals.
- Achieve Sales Goals: Stay on top of your sales targets and ensure that your team is on track to meet them by building a target-driven sales environment across your team.
By maintaining a well-organized sales pipeline, you can ensure that your sales process runs smoothly and that your team is equipped to close deals efficiently.
With pipeline management covered, let’s review the top tools and software for creating sales funnel reports.
Sales Funnel Report Tools and Software
Creating and managing sales funnel reports is made easier with the right tools and software. Here are some popular options that can help you track sales performance and make data-driven decisions:
- HubSpot: A comprehensive CRM platform that offers robust sales analytics and reporting features.
- Google Analytics: While primarily a web analytics tool, it can provide valuable insights into your marketing funnel and lead generation efforts.
- Salesforce: A powerful CRM tool that offers extensive sales pipeline management and reporting capabilities.
- Plecto: A performance dashboard tool that helps visualize sales data and track team performance.
- Nutshell: A user-friendly CRM that offers sales automation, pipeline management, and reporting features.
Reporting tools can track the effectiveness of both outbound strategies like cold calling and inbound channels such as organic search, helping businesses allocate resources effectively, especially when they are paired with sales leaderboard best practices that keep performance visible and motivating.
These tools provide a range of features, including:
- Pipeline management
- Sales analytics
- Communication and collaboration tools
- Sales enablement tools
By leveraging these tools, businesses can create and manage effective sales funnel reports, track sales performance, and make informed decisions to drive success.
Now that you know which tools to use, let’s see how to double-down on what works in your sales funnel.
5 Common Sales Funnel Report Mistakes (And How to Fix Them)
Even experienced teams make critical errors when creating sales funnel reports. Avoid these common pitfalls:
Mistake 1: Tracking Vanity Metrics Instead of Revenue Drivers
The problem: Focusing on total leads or opportunities without considering quality or close rates.
The fix: Track lead-to-revenue conversion, not just lead volume. A funnel with 100 high-quality leads converting at 30% beats 1,000 low-quality leads converting at 2%.
Mistake 2: Ignoring Time-Based Trends
The problem: Looking at funnel snapshots without tracking changes over time.
The fix: Create month-over-month and quarter-over-quarter trend reports. Seasonal patterns and market changes significantly impact funnel performance.
Mistake 3: Not Segmenting by Key Variables
The problem: Treating all opportunities the same regardless of deal size, industry, or product line.
The fix: Segment funnels by:
- Deal size: Small (<$10K), Medium ($10K-$50K), Large ($50K+)
- Lead source: Inbound vs. outbound, channel-specific
- Product line: Different products have different sales cycles
- Region: Geographic markets behave differently
Mistake 4: Failing to Define Clear Stage Criteria
The problem: Vague stage definitions lead to inconsistent data and inaccurate reports.
The fix: Document specific entry/exit criteria for each stage. Example:
- Qualified Lead: Must have budget, authority, need, timeline (BANT)
- Opportunity: Has received demo and expressed clear buying intent
- Proposal: Formal quote sent with defined decision date
Mistake 5: Creating Reports No One Acts On
The problem: Beautiful dashboards that don’t drive behavior change.
The fix: Build actionable alerts and notifications into your reports:
- Alert when deal velocity slows by >20%
- Notify when opportunities sit in one stage >30 days
- Flag when win rates drop below acceptable thresholds
- Celebrate when conversion rates improve (positive reinforcement drives behavior)
🎯 Action Step: Review your current funnel report against these five mistakes. If you’re making 3 or more, your data is likely misleading your strategy. Platforms like Spinify automate many of these best practices, providing real-time alerts and properly segmented views that keep your team focused on the metrics that actually drive revenue.
Double-Down on What Works
Finally, a sales funnel report shouldn’t just help you identify what’s wrong.
It should also help you see and repeat what you’re doing right; be that certain actions or phases that simply win customers over.
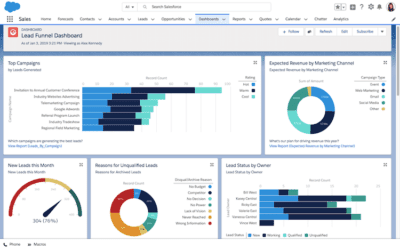
This Salesforce example is particularly good for getting a detailed look at every phase of your sales funnel.
With a report like this, you’ll be able to see which actions within each stage are driving the most success. And when you can see it, you can repeat it.
Unlocking Success: The Power of Sales Funnel Reports
In conclusion, implementing effective sales funnel reports is crucial for understanding and optimizing the sales process. By utilizing visually engaging charts, tracking revenue and conversion rates, identifying funnel leaks, and monitoring team performance, businesses can gain valuable insights to drive better outcomes. Comprehensive dashboards and reports highlighting successful actions empower teams to replicate winning strategies and make informed decisions. With these tools, businesses can enhance efficiency, improve performance, and ultimately maximize revenue potential.
It’s time to take action!
By embracing sales funnel reports, companies can transform their sales strategies and processes. These reports not only provide a clear picture of each stage of the sales funnel but also help in pinpointing areas that require attention. As businesses delve deeper into the data, they can uncover trends and patterns that were previously unnoticed. This data-driven approach enables sales teams to focus their efforts more effectively, ensuring that resources are allocated efficiently to areas with the highest potential for conversion.
Moreover, sales funnel reports can be instrumental in aligning marketing and sales efforts. By analyzing the flow of leads through the funnel, marketing teams can adjust their strategies to generate more qualified leads, ultimately leading to a more seamless transition from marketing to sales. This alignment ensures that both teams are working towards common goals, enhancing the overall customer journey and boosting customer lifetime value.
In addition, sales funnel reports can aid in forecasting and planning. By understanding historical data and current trends, businesses can make more accurate predictions about future sales performance. This foresight allows companies to set realistic targets, plan for growth, and allocate resources strategically.
In a rapidly changing business environment, staying ahead of the competition is vital. Sales funnel reports offer a competitive edge by providing the insights needed to adapt and innovate. As businesses continue to evolve, those who leverage the power of sales funnel reports will be better positioned to succeed and thrive in the marketplace.
So, don’t wait any longer. Start integrating sales funnel reports into your business strategy today and unlock the full potential of your sales process!