Understanding Team Performance Dashboards for Teams
Performance dashboards are no longer just “nice-to-haves.” They are foundational to how high-performing teams track, measure, and optimize their outputs. In simple terms, a performance dashboard aggregates key metrics and visualizes team activity and goal progression in real time. It’s a single source of truth that brings clarity amid the chaos of endless emails, meetings, and disconnected tools.
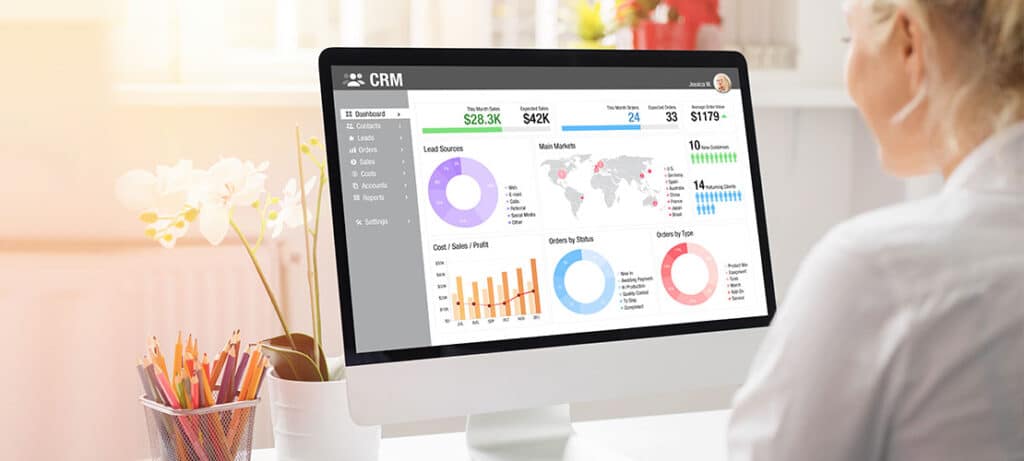
What distinguishes a team dashboard from general business dashboards is its focus on collective action and team-based outputs. Think sales pipelines, project completion rates, call volumes, or NPS scores, all rendered visually and interactively. A team performance dashboard provides real-time updates on team activities and productivity, allowing users to monitor progress on multiple projects and make data-driven decisions to enhance overall team effectiveness.
At Spinify, the emphasis is on making these dashboards not just informative, but truly engaging. When a team can see their progress live and understand how they contribute to bigger goals, magic happens. And it’s not just theoretical—countless teams, from startups to Fortune 500s, have reshaped their workflows around real-time, collaborative performance tracking.
What is a Performance Dashboard?

A performance dashboard is a powerful tool that visually represents key performance indicators (KPIs) and metrics, helping organizations track and measure their progress towards specific goals and objectives. By monitoring and analyzing data in real-time, performance dashboards provide actionable insights that enable data-driven decision-making across various contexts, including sales, marketing, finance, and operations.
For sales teams, a performance dashboard is indispensable. It centralizes critical data, allowing sales reps to monitor their progress, identify areas for improvement, and refine their sales strategies. By tracking sales productivity and performance, these dashboards help sales teams stay aligned with their revenue goals and business objectives. Whether it’s monitoring the number of sales calls made, deals closed, or customer satisfaction scores, a performance dashboard ensures that sales teams have the information they need to succeed.
Why Teams Struggle Without Dashboards
Imagine driving across a country without a GPS or map. You might eventually arrive—but not without frustration, detours, and wasted fuel. That’s exactly how teams operate without performance dashboards.
When KPIs are buried in spreadsheets or siloed in different tools, teams lack visibility. This often leads to duplicated work, misaligned priorities, and missed targets. According to Gallup, only 50% of employees know what’s expected of them at work. That stat is damning, and it’s exactly what a strong dashboard corrects.
The Rise of Metrics-Driven Sales Performance Management
The modern workforce is more data-literate than ever. With the rise of remote and hybrid teams, leaders are doubling down on performance visibility—not to micromanage, but to empower. Dashboards centralize that visibility and build trust.
Platforms like Atlassian and Salesforce have capitalized on this trend by offering extensive analytics tools, yet they often lack the lightweight agility teams need daily. That’s where intuitive solutions like Spinify shine: they balance simplicity and power without sacrificing UX.
Real-Time Visibility: A Competitive Advantage
One of the most overlooked benefits of a performance dashboard is real-time feedback. When teams don’t have to wait until the end of the week or quarter to know how they’re doing, they can course-correct on the fly. That agility directly translates to higher revenue and better customer outcomes.
Sales engagement tools help sales representatives automate tasks and personalize outreach, thereby increasing customer interactions and meetings booked. This allows teams to focus more on selling.
For example, marketing teams using dashboards from Monday.com have reported up to 25% faster campaign cycles. The same principles apply across sales, support, operations, and development teams.
What Makes a Dashboard “The Best”?
So what sets the best dashboard apart?
- Ease of use: It should be intuitive for every team member.
- Customization: Different teams, different goals—one dashboard must serve many needs.
- Real-time updates: Static dashboards = outdated decisions.
- Integration capabilities: The best dashboards connect effortlessly with tools like Salesforce, Slack, or Microsoft Teams.
- Gamification: More on this soon, but the ability to make data fun and motivating is a game-changer.
- Sales performance management: Essential for setting goals, measuring progress, and providing analytical insights to improve sales efficiency.
- Sales productivity tools: Help sales teams increase efficiency and streamline tasks, allowing them to focus on higher-value activities like engaging with prospects and clients.
Key Features of a Performance Dashboard
A top-notch performance dashboard is characterized by several key features that make it an invaluable tool for any organization:
- Real-time Data: The ability to provide real-time updates is crucial. This ensures that users can track progress and make timely decisions based on the most current information available.
- Customizable: Flexibility is key. A performance dashboard should be customizable to meet the specific needs of the organization, allowing users to select the KPIs and metrics that matter most to their unique workflows.
- Visualizations: Effective visualizations, such as charts, graphs, and tables, help users quickly grasp complex data, making it easier to interpret and act upon.
- Drill-down Capabilities: The ability to drill down into specific data points provides a deeper understanding of performance, enabling users to uncover insights that might not be immediately apparent.
- Alerts and Notifications: Alerts and notifications keep users informed of any changes or anomalies in performance, ensuring that they can respond promptly to any issues.
For sales teams, these features translate into specific functionalities that drive success:
- Sales Pipeline Management: A visual representation of the sales pipeline, including the number of leads, opportunities, and closed deals, helps sales teams manage their workflow effectively.
- Sales Productivity Metrics: Metrics such as sales calls, emails, meetings, conversion rates, and sales cycle length provide a comprehensive view of sales productivity.
- Revenue Tracking: Real-time views of revenue performance, including sales revenue, customer acquisition costs, and customer lifetime value, help sales teams stay on top of their financial goals.
- Team Performance Metrics: Metrics that track team sales performance, sales productivity, and customer satisfaction ensure that the entire team is aligned and performing at their best.
High-Impact KPIs for High-Performing Teams
Not all metrics are created equal. A bloated dashboard with 50+ KPIs is worse than none at all. The key is focus.
Integrating customer data into the sales planning process can significantly enhance sales strategies and improve team alignment. Spinify helps teams zero in on meaningful KPIs—whether that’s daily calls, closed deals, or customer satisfaction. By tailoring the dashboard to your unique workflows, you eliminate noise and empower action.
From Spreadsheets to Insights: A Shift in Thinking
Data trapped in rows and columns is useless unless interpreted. Dashboards do the heavy lifting by converting raw numbers into patterns and visual stories. This shift from passive tracking to active insight generation is exactly why teams are leaving Excel behind.
Team Alignment Through Transparency
Alignment isn’t about top-down mandates—it’s about shared visibility. When everyone can see what “winning” looks like and where they stand, collaboration increases. High-performing teams like those at Canva attribute much of their success to this kind of radical transparency.
Fuel Performance with Purposeful Metrics
Tracking performance is one thing. Driving performance is another.
That’s why Spinify blends dashboards with motivational psychology. By celebrating milestones, giving instant recognition, and creating healthy competition, dashboards become more than tools—they become a source of daily energy.
Spinify Isn’t Just a Dashboard. It’s a Game Changer.
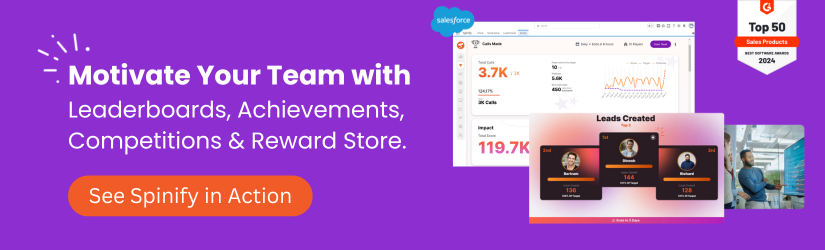
Spinify doesn’t just show you metrics—it amplifies them. With integrations across Salesforce, HubSpot, and more, it becomes a performance command center. But what really sets Spinify apart is its gamified experience layer.
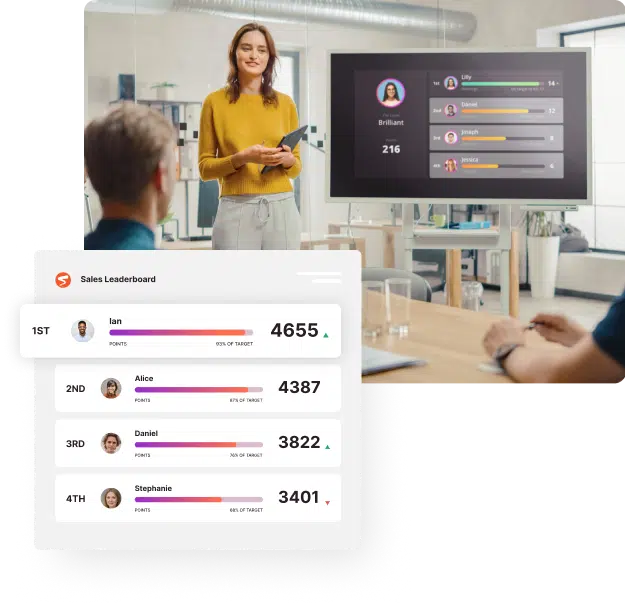
Trophies, leaderboards, music cues when milestones are hit—these little nudges make a big impact.
How Spinify Transforms Team Performance
Let’s say your SDR team is underperforming. Rather than emailing reminders or holding emergency stand-ups, Spinify lets you set clear targets and visualize real-time progress. Sales reps see exactly how close they are to goal, what peers are crushing it, and how they can get there.
Revenue teams play a crucial role in determining effective strategies for achieving top sales performance. Tools like Spinify empower these teams by providing insights that help optimize customer interactions and improve overall sales productivity.
Teams using Spinify report:
- 2x faster goal attainment
- 40% more peer-to-peer recognition
- A noticeable drop in burnout and disengagement
Integrating CRM and Customer Data for Better Insights
Without CRM integration, your dashboard is just a guessing game. Spinify’s real-time syncing with platforms like Salesforce and HubSpot ensures that every closed deal or missed call is reflected instantly. This means better forecasting, tighter feedback loops, and smarter decision-making.
A team utilization dashboard can help manage team workloads by increasing or decreasing the number of tasks assigned to team members. This feature enables users to track, report, and filter tasks based on their status, thereby enhancing productivity and resource allocation.
The Psychology Behind Visual Performance Tracking
People are visual creatures. Seeing progress as a chart, bar, or badge triggers intrinsic motivation. Spinify taps into this by turning performance metrics into mini wins and visual rewards—an essential shift for companies looking to drive engagement.
A team management dashboard is a powerful tool for monitoring team performance and productivity. It tracks individual tasks, organizes schedules with calendar integrations, and simplifies reporting, ultimately allowing managers to make informed decisions to enhance team efficiency.
Gamification as a Driver of Excellence

Gamification isn’t fluff—it’s science-backed. According to a study by TalentLMS, 89% of employees say gamification makes them more productive. Spinify brings this principle to life through custom competitions, avatars, point systems, and even theme songs for success.
Case Study: How HubSpot Uses Performance Dashboards
HubSpot’s sales teams use performance dashboards to identify pipeline bottlenecks, track rep productivity, and ensure forecast accuracy. By combining data transparency with motivational design, their teams consistently outperform targets—and much of that is attributed to visibility and shared accountability.
A team metrics dashboard provides a centralized tool for monitoring team performance and activities, tracking daily agendas, visualizing tracked time over various periods, and offering an overview of project statuses, all aimed at enhancing productivity and facilitating better organizational insights.
Avoiding Common Pitfalls in Dashboard Design
Too many metrics. Too few filters. Overly complex UX. These are dashboard killers.
The best dashboards are clean, purpose-driven, and align with your team’s daily flow. Spinify’s design toolkit ensures that even non-technical users can create dashboards that work.
Best Practices for Implementing a Performance Dashboard
Implementing a performance dashboard requires careful planning and execution to ensure it delivers maximum value. Here are some best practices to consider:
- Define Clear Goals and Objectives: Start by defining what you want to achieve with the performance dashboard. Clear goals and objectives will guide the selection of metrics and the overall design of the dashboard.
- Choose the Right Metrics: Select metrics that align with your goals and objectives and provide actionable insights. Focus on metrics that matter most to your team’s success.
- Keep It Simple: Avoid overwhelming users with too much data or complexity. A simple, easy-to-use dashboard is more likely to be adopted and used effectively.
- Make It Actionable: Ensure that the dashboard provides insights that enable users to make data-driven decisions. The goal is to turn data into action.
- Monitor and Adjust: Continuously monitor the dashboard’s performance and make adjustments as needed to ensure it remains relevant and effective.
For sales teams, these best practices translate into specific actions:
- Integrate with CRM: Integrate the performance dashboard with your CRM system to ensure seamless data flow and accuracy. This integration allows for real-time updates and a comprehensive view of sales activities.
- Provide Training and Support: Ensure that sales reps understand how to use the dashboard and interpret the data. Provide training and ongoing support to help them get the most out of the tool.
- Regularly Review and Adjust: Regularly review the dashboard with sales reps and make adjustments as needed. This ensures that the dashboard remains relevant and continues to meet the team’s needs.
- Use Data to Drive Coaching: Use insights from the dashboard to drive coaching and training initiatives. Help sales reps improve their performance by providing targeted feedback and support.
- Celebrate Successes: Recognize and celebrate the successes of sales reps using data from the dashboard. This not only boosts morale but also reinforces positive behaviors and performance.
By following these best practices, sales teams can leverage performance dashboards to drive productivity, improve performance, and achieve their business objectives.
Customization vs Standardization in Dashboards
Standardization ensures consistency. Customization ensures relevance.
Spinify strikes the balance with templates you can tweak to fit your team’s exact needs. Want to track deal velocity for a sales pod but engagement for your CS team? Easy.
Making Data Digestible for Everyone
Your dashboard shouldn’t require a degree in data science. Spinify translates metrics into human language—charts, emojis, leaderboards—so everyone from intern to CEO can understand and act.
Setting Goals That Inspire, Not Intimidate
Goals should stretch, not stress. Spinify lets you layer in tiers, milestones, and coaching prompts to ensure that goals feel achievable—and team members stay motivated rather than overwhelmed.
Engagement-First Dashboards in Remote Teams
For remote or hybrid teams, dashboards double as a digital water cooler. Spinify’s real-time feedback and celebratory moments help distributed teams stay emotionally and productively connected.
Leaderboards That Don’t Create Conflict

Some worry leaderboards create toxic competition. The key? Make it fun, inclusive, and team-oriented.
Spinify lets you run team-based challenges and celebrate improvements—not just outcomes—making recognition accessible to all.
Celebrating Wins in a Measurable Way
Big or small, every win counts. Spinify’s celebration features—like achievement music, digital badges, and public shoutouts—boost morale and reinforce winning behaviors.
Building a Culture of Accountability with Dashboards
Dashboards don’t just track—they transform culture. When teams own their numbers and leaders reinforce them with coaching and recognition, accountability becomes the norm, not the exception.
Choosing the Right Dashboard for Your Team
Every team is different. Your dashboard should be too. Whether you’re scaling sales or energizing your support desk, the right dashboard adapts as you grow. Spinify’s flexibility ensures it scales with your team.
Turn Data into Impact Today
The best performance dashboards don’t just show you what’s happening—they help you shape what’s next. With Spinify, teams unlock new levels of focus, engagement, and performance, without adding complexity.
🚀 Want to see how it works for your team? Book a free demo with Spinify today.